T>T: LaTeX for Energy Level Transition Diagrams
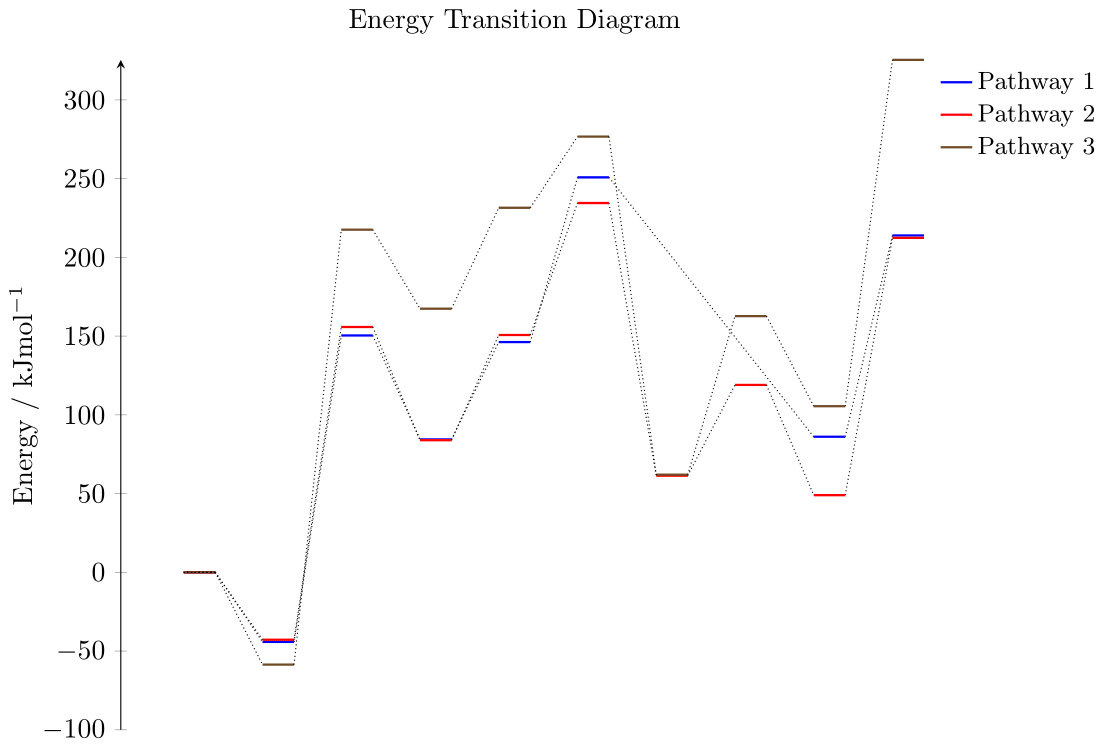
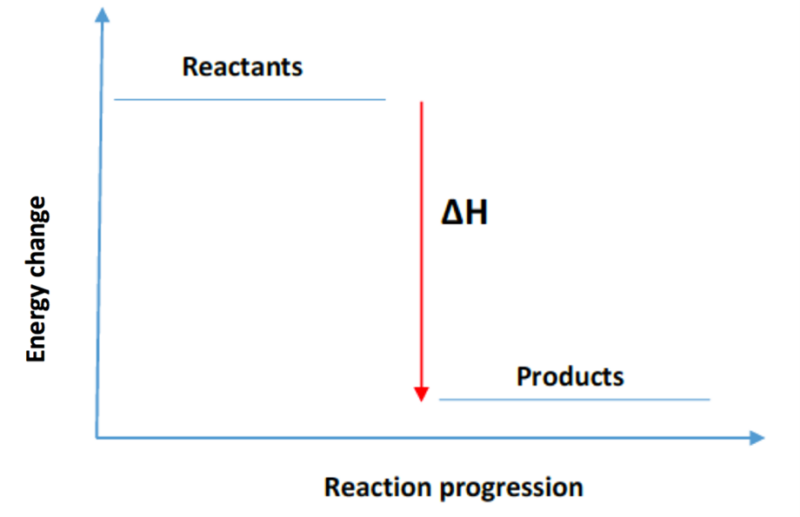
The Problem During my PhD I worked with chemists who would need to create energy level transition diagrams for use in presentations and publications such as those seen below.
This process took them ages as they would manually build the diagrams in powerpoint and need to place every level and join the lines up by hand. I thought this was madness so wrote a LaTeX script to automatically build these diagrams in under a second. I re-discovered my old script the other day so thought to post it here and describe how it works.
First we look at the entire code and then discuss in detail how it works. Feel free to modify it for your own use case(s).
Complete LaTeX Code
1
2
3
4
5
6
7
8
9
10
11
12
13
14
15
16
17
18
19
20
21
22
23
24
25
26
27
28
29
30
31
32
33
34
35
36
37
38
39
40
41
42
43
44
45
46
47
48
49
50
51
52
\documentclass{standalone}
\usepackage{pgfplots,pgfplotstable}
\usepgflibrary{plotmarks}
\usetikzlibrary{calc}

\pgfplotstableread[col sep=comma]{data.csv}\datatable

\begin{document}
	\begin{tikzpicture}[x=1cm, y=0.2mm]
		\begin{axis}[
			every axis plot post/.style={mark=-,thick,mark size=2mm},
			ylabel=Energy / kJmol$^{-1}$,
			xtick=\empty,
			legend pos=outer north east,
			xmin=-1,
			ymin=-100,
			axis lines=left,
			xtick=\empty,
			hide x axis,
			legend entries={\small Pathway 1, \small Pathway 2,\small Pathway 3},
			legend style={draw=none},
			title=Energy Transition Diagram,
			anchor=origin,
			disabledatascaling,
			only marks,
			x=1cm, y=0.2mm,]
			\pgfplotstablegetcolsof{\datatable}
			\pgfmathsetmacro\numberofycols{\pgfplotsretval-1}
			\pgfplotsinvokeforeach {0,...,\numberofycols}{
				\addplot table[x expr=\coordindex, y index=#1] {\datatable};
			}
		\end{axis}

		\pgfplotstablegetcolsof{\datatable}
		\pgfmathsetmacro\numberofcols{int(\pgfplotsretval)-1}

		\foreach \case in {0,...,\numberofcols} {
			\pgfplotstablegetcolumnnamebyindex{\case}\of\datatable\to\colname
			\xdef\previndex{0}
			\xdef\prevlevel{0}
			\pgfplotstableforeachcolumnelement{\colname}\of\datatable\as\level{
				\pgfmathfloatparsenumber{\level}
				\pgfmathfloatgetflagstomacro\pgfmathresult\flags
				\ifnum\flags=3\relax\else
				\draw[densely dotted] ($(\previndex,\prevlevel)+(0.2,0)$) -- ($(\pgfplotstablerow,\level)+(-0.2,0)$);
				\xdef\previndex{\pgfplotstablerow}
				\xdef\prevlevel{\level}
				\fi
			}
		}
	\end{tikzpicture}
\end{document}
Discussion
The main idea of this script is to use pgfplots to draw the levels and use tikz to connect them all together in sequence.
- Preamble
First we define the document class as
standalonewhich is useful for generating standalone images. Theborder=5mmspecifies a 5mm border around the image.\usepackage{pgfplotstable}: This package is used for handling tables and creating plots from data.\usetikzlibrary{calc}: This library provides additional functionalities for calculations within TikZ.1 2 3
\documentclass[border=5mm]{standalone} \usepackage{pgfplotstable} \usetikzlibrary{calc}
- Load Data
- Next we load the
.csvfile containing the data. The data in the csv file has the following format
one two three 0.0 0.0 0.0 -54.2 nan -15 130.4 145.8 30 34.1 53.6 -140 113.9 162.8 -40 where
one, two, threecorrespond to the different reaction pathways.To read the file, we do the following
1
2
  % load the CSV file
  \pgfplotstableread[col sep=comma]{data.csv}\datatable
- Next we load the
TikZ Picture Environment
\begin{tikzpicture}[x=1cm, y=0.2mm]: This starts a TikZ picture environment with specified units for the x and y axes. All subsequent drawing commands will be within this environment.
- Axis Setup
\begin{axis}[ ... ]: This part configures the axis for the plot using thepgfplotspackage. We include things such as labels, legend, limits, axis lines, tick marks, and the overall style of the plot. See the configuration options in the above full code.
Plotting Data Points
1
2
3
4
5
 \pgfplotstablegetcolsof{\datatable}
 \pgfmathsetmacro\numberofycols{\pgfplotsretval-1}
 \pgfplotsinvokeforeach {0,...,\numberofycols}{
     \addplot table[x expr=\coordindex, y index=#1] {\datatable};
 }
\pgfplotstablegetcolsof{\datatable}: This command retrieves the number of columns in the data table.\pgfmathsetmacro\numberofycols{\pgfplotsretval-1}: This calculates the number of y-columns. We need to subtract 1 to take into account that indices start at 0 and not 1.\pgfplotsinvokeforeach {0,...,\numberofycols}{ ... }: This loop iterates over the y-columns of data we just extracted, plotting the main data points by adding the x and y values from the table usingaddplot table.
Connecting Lines
1
2
3
4
5
6
7
8
9
10
 % select the table to find the columns of
 \pgfplotstablegetcolsof{\datatable}
 % get the number of y columns
 \pgfmathsetmacro\numberofcols{int(\pgfplotsretval)-1} % Subtract 1 to exclude the label column

 \foreach \case in {0,...,\numberofcols} {
     \pgfplotstablegetcolumnnamebyindex{\case}\of\datatable\to\colname

     \xdef\previndex{0}
     \xdef\prevlevel{0}
\foreach \case in {0,...,\numberofcols}: This loop dynamically iterates over the number of columns.\xdef\previndex{0}and\xdef\prevlevel{0}initialize variables to keep track of the previous row index and energy level.
1
2
3
4
5
6
7
8
9
 \pgfplotstableforeachcolumnelement{\colname}\of\datatable\as\level{
     \pgfmathfloatparsenumber{\level}
     \pgfmathfloatgetflagstomacro\pgfmathresult\flags
     \ifnum\flags=3\relax\else
     \draw[densely dotted] ($(\previndex,\prevlevel)+(0.2,0)$) -- ($(\pgfplotstablerow,\level)+(-0.2,0)$);
     \xdef\previndex{\pgfplotstablerow}
     \xdef\prevlevel{\level}
     \fi
 }
\pgfplotstableforeachcolumnelement{\colname}\of\datatable\as\level{ ... }iterates over each element in the current column.Inside the loop, the energy level is extracted and checked for validity using
\pgfmathfloatgetflagstomacro.If the energy level is valid, a densely dotted line is drawn from the previous point to the current point, and the variables
\previndexand\prevlevelare updated.
Output
Compiling the above code produces the following energy transition plot, in a fraction of a second!